

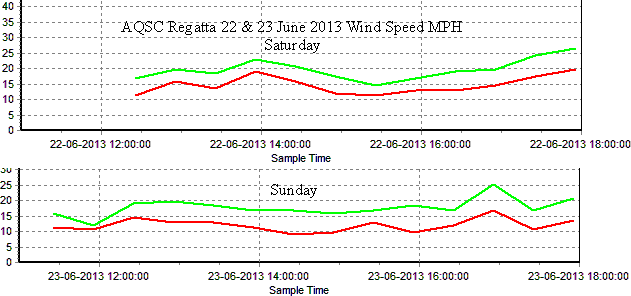


Wind Speed Graphs 2013
A Weather Station (WS) is often in use with the sensors mounted on a pole above the fence behind the clubhouse; the display is in the clubhouse. The output can be imported to a PC and graphs displayed.
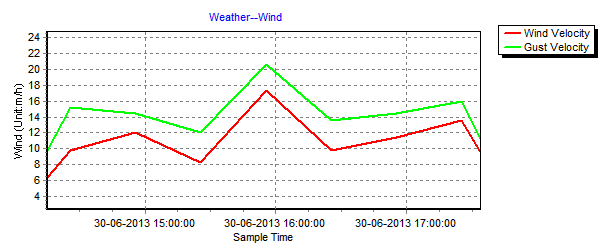
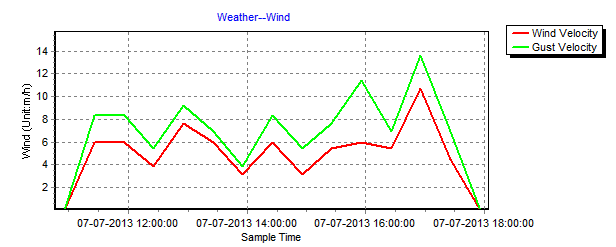
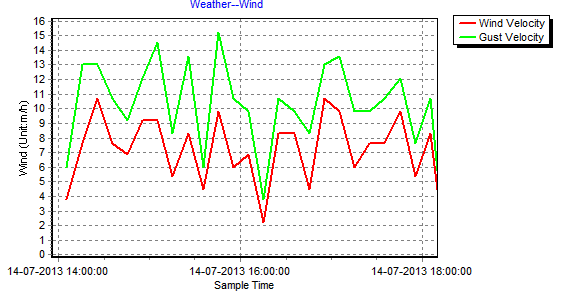
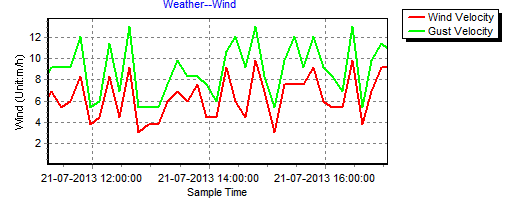
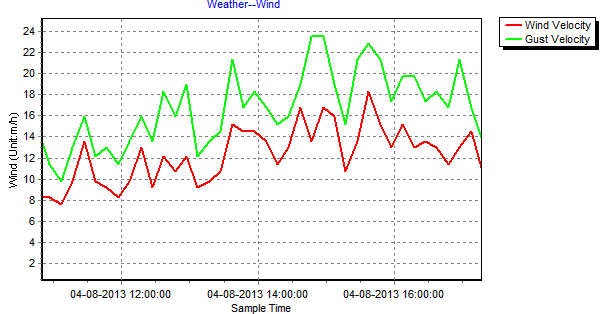
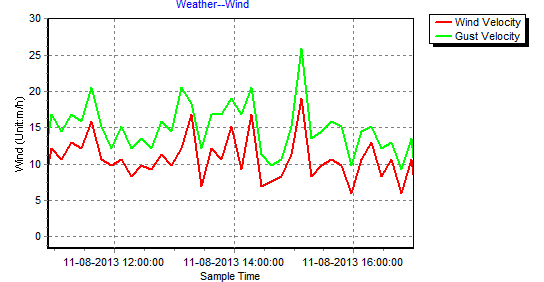
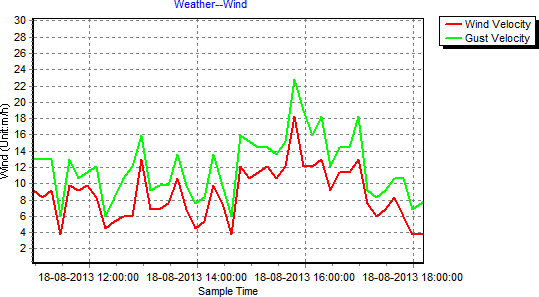
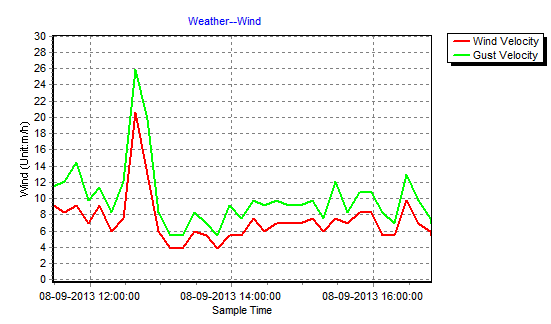
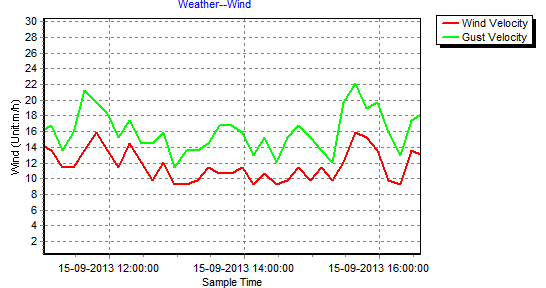
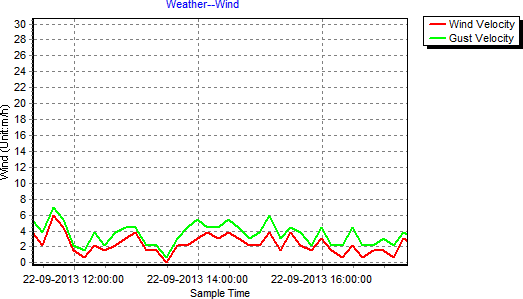
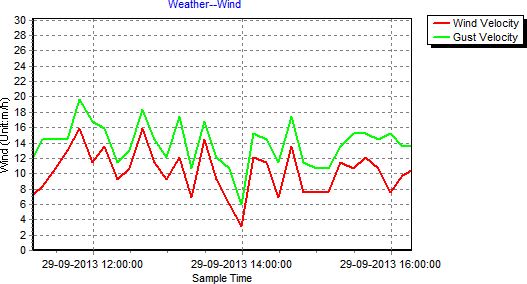
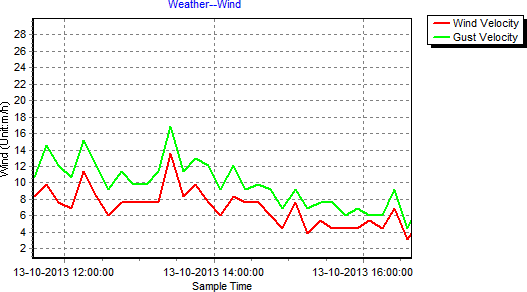
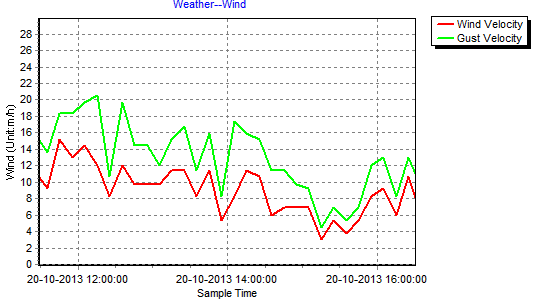
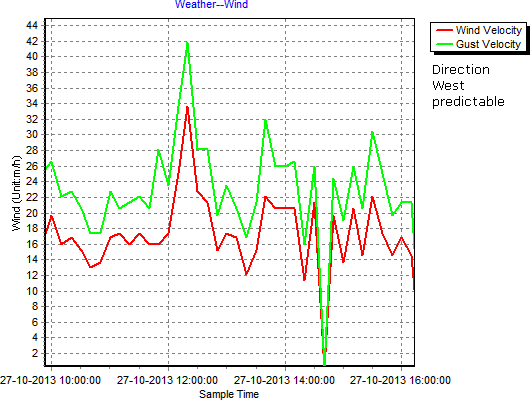
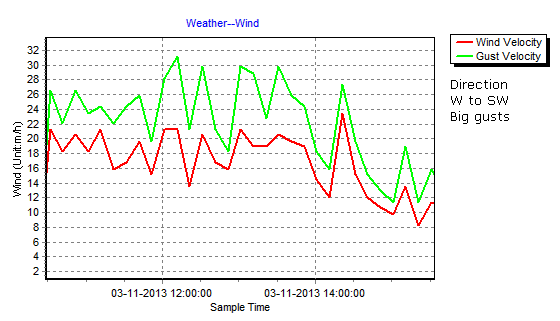
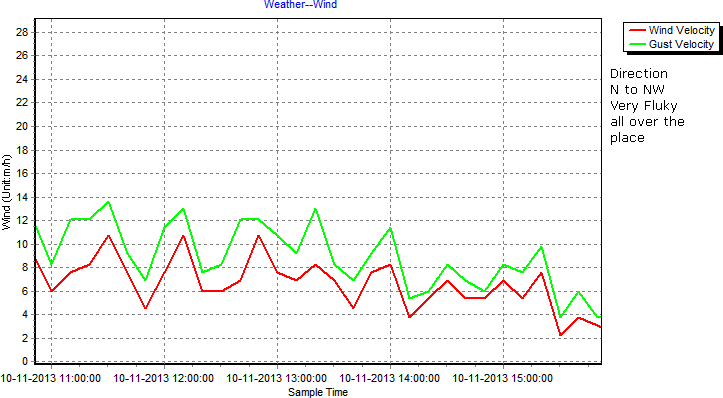
Wind speed displayed is evaluated from 24 readings over a 48 second period; average is the average of the 24 readings and gust is the maximum of the 24 readings. Readings are stored every 10 minutes.
Hover over a date to display a wind speed graph; the red line is average and green is gusts in MPH. The wind experienced by the sensors may be very different to that experienced by boats at a much lower level.