
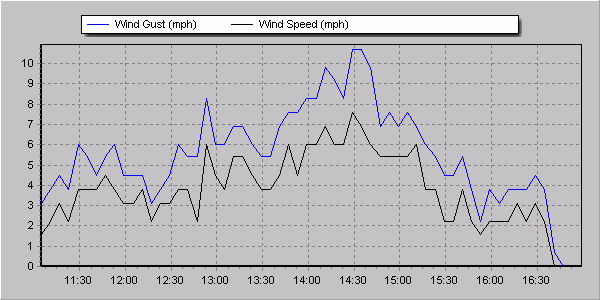
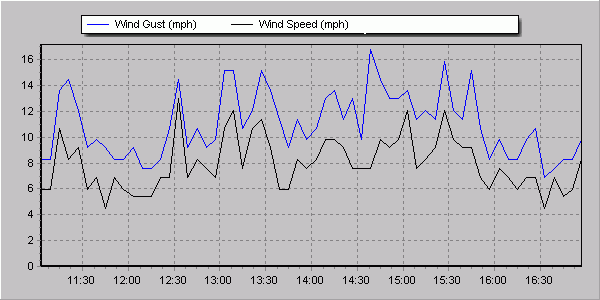
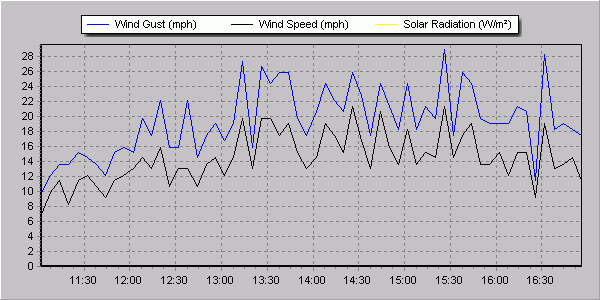
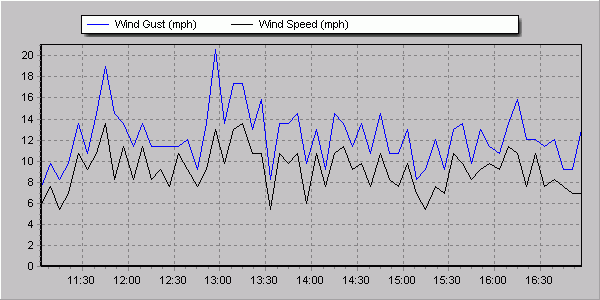
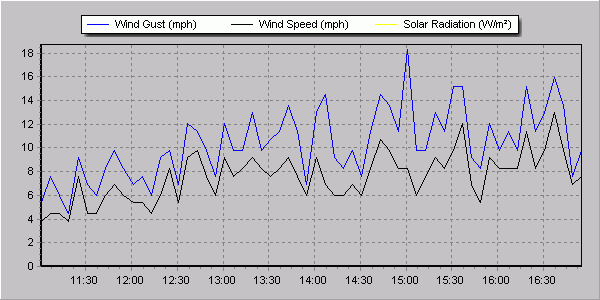
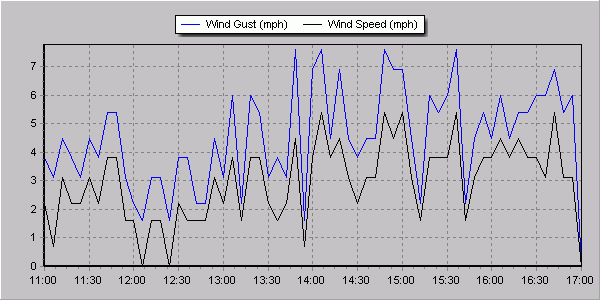
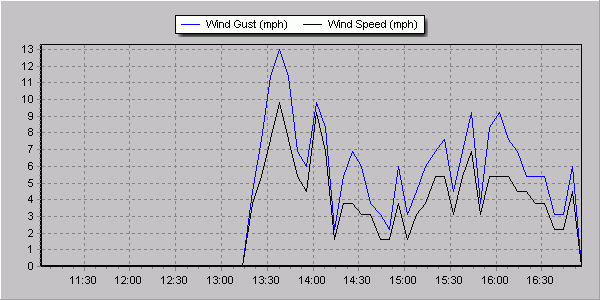
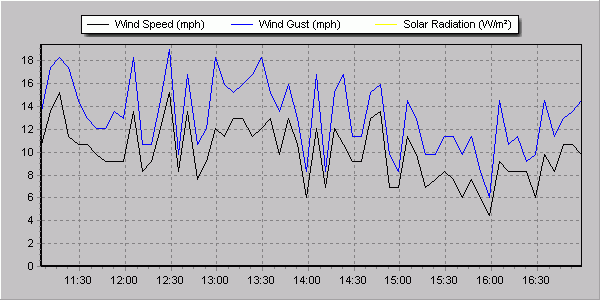
Wind Speed Graphs 2014
The Weather Station sensor is mounted on a pole by the fence behind the clubhouse.
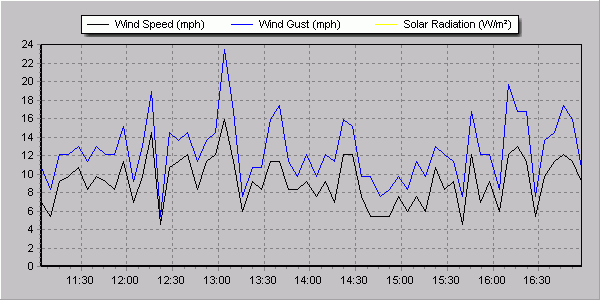
The wind at the sensor is very different to that at the boats at a much lower level; the estimated direction and force is included after the date.
Click on a date to display a wind speed graph. You can then then step through the graphs or play a slide show. To exit the graphs press Esc or click the background.
09 Nov S-
26 Oct WSW very gusty, shifty, fluky 2-
19 Oct WSW very gusty, shifty, fluky 2-
12 Oct ENE 0-
05 Oct S 0-
21 Sep N 1-
06 Jul W 0-